Cultic Studies Journal, Vol. 2 No. 1 1985, Page 64
Outcome measures
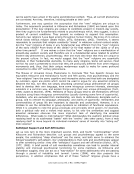
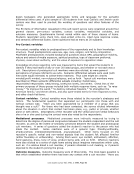
There has been a substantial degree of direct contact between representatives of cults and
these high school students. The majority of students in our entire sample (535, or 54%)
reported at least one contact with a recruiter. But more unexpected were the large number
of multiple contacts noted by those who had been approached. One-third reported one or
two contacts, two-fifths had three to five contacts, and a fourth claimed to have been
involved in six or more such exposures.
An analysis of student reactions to the hypothetical invitation to a cult meeting provides the
following breakdown: 46% definitely would not go, while among those not rejecting the
officer: 21% were ―not sure‖ if they would go, 21% might go out of ―curiosity,‖ 17% might
go ―if a friend did,‖ and 2% would definitely go (some students checked more than one
category).
After deleting subjects with invalid answers on either the question of contact with a recruiter
or likelihood of accepting an invitation, we still were left with 51% who were open to
considering or accepting such an invitation, and 49% who stated they would reject that
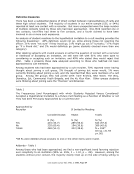
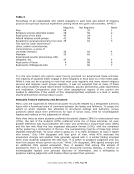
offer. Table 1 presents these data analyzed according to those who had/had not been
approached by cult members.
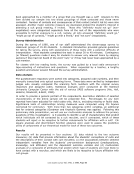
Among students who had been approached by a cult recruiter, 70% reported never having
thought about joining a cult group, 2% thought of joining but never would, 1% were
currently thinking about joining a cult, and 3% reported that they were members of a cult
group. Among the groups they had joined were: hare Krishna, New Wave, The Way,
Dianetics, Est, Communist Youth Brigade, and the Ku Klux Klan. Other groups students
were thinking about joining were the ―Moonies‖ and Eckankar.
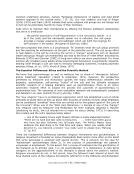
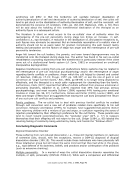
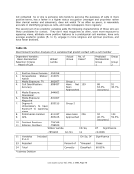
Table 1
The Frequencies (and Percentages) with which Students Rejected Versus Considered/
Accepted a Hypothetical Invitation to a Future Cult Meeting as a Function of Whether or not
They had been Previously Approached by a Cult Recruiter
Approached by
Recruiter If Invited to Meeting:
Consider/Accept Reject Totals
N (%)N (%)N (%)
Yes 234 (44.7) 289 (55.3) 523 (57.3)
No 235 (60.4) 154 (39.6) 389 (42.6)
Totals 469 (51.4) 443 (48.6) N =912*
Chi sq.=21.93
p.001
*88 Ss were deleted whose answers to one or the other items were invalid.
Addenda -Table 1
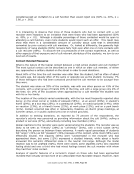
Among those who had been approached, we find a non-significant trend favoring rejection
over receptivity to an invitation (55% vs. 45%, z =1.42, p =.08). However, among the
students without prior contact, the majority clearly lined up on the side of being willing to
Outcome measures
There has been a substantial degree of direct contact between representatives of cults and
these high school students. The majority of students in our entire sample (535, or 54%)
reported at least one contact with a recruiter. But more unexpected were the large number
of multiple contacts noted by those who had been approached. One-third reported one or
two contacts, two-fifths had three to five contacts, and a fourth claimed to have been
involved in six or more such exposures.
An analysis of student reactions to the hypothetical invitation to a cult meeting provides the
following breakdown: 46% definitely would not go, while among those not rejecting the
officer: 21% were ―not sure‖ if they would go, 21% might go out of ―curiosity,‖ 17% might
go ―if a friend did,‖ and 2% would definitely go (some students checked more than one
category).
After deleting subjects with invalid answers on either the question of contact with a recruiter
or likelihood of accepting an invitation, we still were left with 51% who were open to
considering or accepting such an invitation, and 49% who stated they would reject that
offer. Table 1 presents these data analyzed according to those who had/had not been
approached by cult members.
Among students who had been approached by a cult recruiter, 70% reported never having
thought about joining a cult group, 2% thought of joining but never would, 1% were
currently thinking about joining a cult, and 3% reported that they were members of a cult
group. Among the groups they had joined were: hare Krishna, New Wave, The Way,
Dianetics, Est, Communist Youth Brigade, and the Ku Klux Klan. Other groups students
were thinking about joining were the ―Moonies‖ and Eckankar.
Table 1
The Frequencies (and Percentages) with which Students Rejected Versus Considered/
Accepted a Hypothetical Invitation to a Future Cult Meeting as a Function of Whether or not
They had been Previously Approached by a Cult Recruiter
Approached by
Recruiter If Invited to Meeting:
Consider/Accept Reject Totals
N (%)N (%)N (%)
Yes 234 (44.7) 289 (55.3) 523 (57.3)
No 235 (60.4) 154 (39.6) 389 (42.6)
Totals 469 (51.4) 443 (48.6) N =912*
Chi sq.=21.93
p.001
*88 Ss were deleted whose answers to one or the other items were invalid.
Addenda -Table 1
Among those who had been approached, we find a non-significant trend favoring rejection
over receptivity to an invitation (55% vs. 45%, z =1.42, p =.08). However, among the
students without prior contact, the majority clearly lined up on the side of being willing to