Cultic Studies Journal, Vol. 2 No. 1 1985, Page 61
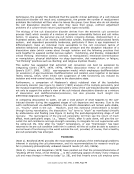
228 schools to be randomly selected (See Babbie, 1979). Then quota-sampling helped
determine how many schools would represent each county, according to the proportion of
its high school population to the total for all the counties. Systematic sampling within each
county list selected the specific schools to be contacted.
Letters of introduction were sent to all prospective schools, followed by phone contacts and
personal interviews with interested administrators. The number of classes per school and
the subsample of number of students per class were chosen to reflect the weighted
proportion of that school‘s population to the total for its county. Finally, students were
drawn from both required courses (World History, Civics, or English) and electives (such as
Psychology or Family Living) in the hope of getting a broader cross section of students than
those taking more specialized courses, e.g., clerical, mechanical, or math. Because a
teacher‘s strike in one county prevented access to its schools, two parochial high schools in
that county were randomly chosen as substitutes. The final sample consisting of 1,012
students with completed surveys was arbitrarily reduced to a round figure of 1,000 for more
ready reader comprehension of the statistical results.
Participants
The 1,000 students who completed our survey questionnaire represent the final sample of
participants obtained from a random selection of schools in counties within the greater San
Francisco Bay Area, and of classrooms within those schools. Our sample was generated
from forty-five different classrooms in twenty schools located in nine counties (some more
than a hundred miles apart), in rural and urban areas.
Although the majority of students were from standard public schools, some participants
represented alternative, continuation, and parochial schools. They ranged in age from 14 to
19 years most clustered around 16 to 18 years of age.
Fifty-four percent of the sample were female, 46% were male. Ethnic and racial composition
of the sample reflected the local county demographics: overall 62% were Caucasian and
38% non-Caucasian. Of the latter, 15% were Black, 12% Hispanic, 5% Asian-American, 3%
Oriental, and 0.5% American Indian. The majority (76%) reported having a religious
affiliation only 20% said they had none. Catholics made up the largest denomination
(43%), followed by Protestants (28%), Jews (4%), Mormons (2%), and Fundamentalists
(I%).
A fair range of socioeconomic backgrounds and academic level of achievement were also
represented in this sample. More than one third of the sample reported father‘s occupation
as professional, technical, managerial, or proprietor, while 22% indicated these were their
mother‘s occupations. About 10% of the fathers and 20% of the mothers were listed as
being in skilled and semi-skilled occupations. The rest were unemployed, retired, disabled or
in a special status, e.g., student, housewife, or househusband. The modal number of
children in the family was 3, a third were fist-born, a fourth second-born, while 42% were
third or later born. Surprisingly, about half of all these youngsters came from single-parent
homes. Residential stability varied considerably: 35% had moved within the last three
years, 15% felt they moved frequently, but 65% had lived at their current address for at
least 4 years, while 55% reported never having moved. Reported grade-point average
suggests a grade-inflated distribution with nearly 60% above average, 38% average and
only 3% below average. (Other characteristics of these participants will be presented later
along with the descriptive results.)
Survey Instrument
A standardized questionnaire was prepared that reflected different parts of our theoretical
model. The survey instrument was developed, in part, with the help of a ―focus group‖ of a
228 schools to be randomly selected (See Babbie, 1979). Then quota-sampling helped
determine how many schools would represent each county, according to the proportion of
its high school population to the total for all the counties. Systematic sampling within each
county list selected the specific schools to be contacted.
Letters of introduction were sent to all prospective schools, followed by phone contacts and
personal interviews with interested administrators. The number of classes per school and
the subsample of number of students per class were chosen to reflect the weighted
proportion of that school‘s population to the total for its county. Finally, students were
drawn from both required courses (World History, Civics, or English) and electives (such as
Psychology or Family Living) in the hope of getting a broader cross section of students than
those taking more specialized courses, e.g., clerical, mechanical, or math. Because a
teacher‘s strike in one county prevented access to its schools, two parochial high schools in
that county were randomly chosen as substitutes. The final sample consisting of 1,012
students with completed surveys was arbitrarily reduced to a round figure of 1,000 for more
ready reader comprehension of the statistical results.
Participants
The 1,000 students who completed our survey questionnaire represent the final sample of
participants obtained from a random selection of schools in counties within the greater San
Francisco Bay Area, and of classrooms within those schools. Our sample was generated
from forty-five different classrooms in twenty schools located in nine counties (some more
than a hundred miles apart), in rural and urban areas.
Although the majority of students were from standard public schools, some participants
represented alternative, continuation, and parochial schools. They ranged in age from 14 to
19 years most clustered around 16 to 18 years of age.
Fifty-four percent of the sample were female, 46% were male. Ethnic and racial composition
of the sample reflected the local county demographics: overall 62% were Caucasian and
38% non-Caucasian. Of the latter, 15% were Black, 12% Hispanic, 5% Asian-American, 3%
Oriental, and 0.5% American Indian. The majority (76%) reported having a religious
affiliation only 20% said they had none. Catholics made up the largest denomination
(43%), followed by Protestants (28%), Jews (4%), Mormons (2%), and Fundamentalists
(I%).
A fair range of socioeconomic backgrounds and academic level of achievement were also
represented in this sample. More than one third of the sample reported father‘s occupation
as professional, technical, managerial, or proprietor, while 22% indicated these were their
mother‘s occupations. About 10% of the fathers and 20% of the mothers were listed as
being in skilled and semi-skilled occupations. The rest were unemployed, retired, disabled or
in a special status, e.g., student, housewife, or househusband. The modal number of
children in the family was 3, a third were fist-born, a fourth second-born, while 42% were
third or later born. Surprisingly, about half of all these youngsters came from single-parent
homes. Residential stability varied considerably: 35% had moved within the last three
years, 15% felt they moved frequently, but 65% had lived at their current address for at
least 4 years, while 55% reported never having moved. Reported grade-point average
suggests a grade-inflated distribution with nearly 60% above average, 38% average and
only 3% below average. (Other characteristics of these participants will be presented later
along with the descriptive results.)
Survey Instrument
A standardized questionnaire was prepared that reflected different parts of our theoretical
model. The survey instrument was developed, in part, with the help of a ―focus group‖ of a