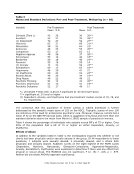
Cultic Studies Journal, Vol. 9, No. 2, 1992, Page 55
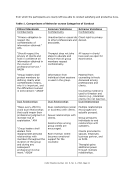
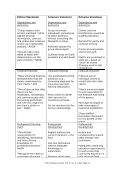
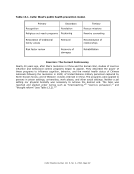
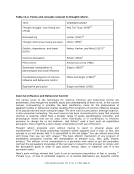
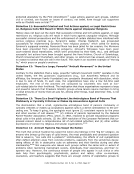
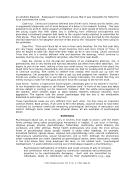
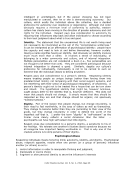
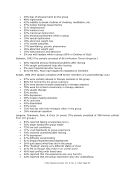
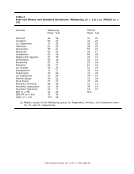
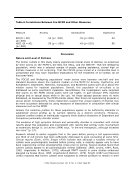
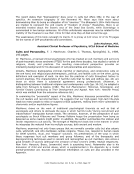
Table 1 (Continued)
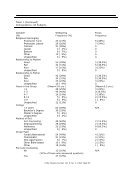
Demographics: All Subjects
Variable Wellspring Focus
(%)Frequency (%)Frequency
Religious Upbringing
Protestant Fund. 23 (21%) 6 (46%)
Protestant Liberal 29 (26%) 7 (54%)
Catholic 31 (28%) 0
Jewish 4 (4%) 0
Eastern 8 (7%) 0
Other 10 (9%) 0
Unspecified 6 (5%) 0
Relationship to Mother
Good 55 (49%) 5 (38.5%)
Fair 34 (31%) 5 (38.5%)
Poor 17 (15%) 3 (23%)
Unspecified 5 (5%) 0
Relationship to Father
Good 42 (38%) 5 (38.5%)
Fair 34 (31%) 5 (38.5%)
Poor 25 (22%) 3 (23%)
Unspecified 10 (9%) 0
Years in the Group (Mean=3.6 yrs.) (Mean=5.5 yrs.)
1 28 (25%) 3 (23%)
1-3 45 (40%) 2(15.5%)
4-7 16 (14%) 5 (38%)
8-12 5 (5%) 2 (15.5%)
13+ 5 (5%) 1 (8%)
Unspecified 12 (11%) 0
College
3 years 65 (59%) N/A
Bachelor‟s Degree 36 (33%)
Master‟s Degree 5 (4%)
Unspecified 5 (4%)
Method of Exit
Exit Counseling 49 (44%) 2 (15.4%)
Deprogramming 28 (25%) 2 (15.4%)
Walkaway 25 (23%) 9 (69.2%)
Unspecified 9 (8%) 0
Group Type
Fundtl.Aberrational 54 (49%) 4 (31%)
Charismatic 21 (19%) 4 (31%)
New Age/Eastern 8 (7%) 2 (15%)
Other Bible-based 10 (9%) 2 (15%)
Other 18 (16%) 1 (8%)
Pre-Cult Counseling
No 13 (10%) N/A
(22% of those who answered question)
Yes 47 (37%)
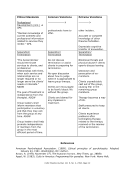
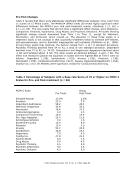
Table 1 (Continued)
Demographics: All Subjects
Variable Wellspring Focus
(%)Frequency (%)Frequency
Religious Upbringing
Protestant Fund. 23 (21%) 6 (46%)
Protestant Liberal 29 (26%) 7 (54%)
Catholic 31 (28%) 0
Jewish 4 (4%) 0
Eastern 8 (7%) 0
Other 10 (9%) 0
Unspecified 6 (5%) 0
Relationship to Mother
Good 55 (49%) 5 (38.5%)
Fair 34 (31%) 5 (38.5%)
Poor 17 (15%) 3 (23%)
Unspecified 5 (5%) 0
Relationship to Father
Good 42 (38%) 5 (38.5%)
Fair 34 (31%) 5 (38.5%)
Poor 25 (22%) 3 (23%)
Unspecified 10 (9%) 0
Years in the Group (Mean=3.6 yrs.) (Mean=5.5 yrs.)
1 28 (25%) 3 (23%)
1-3 45 (40%) 2(15.5%)
4-7 16 (14%) 5 (38%)
8-12 5 (5%) 2 (15.5%)
13+ 5 (5%) 1 (8%)
Unspecified 12 (11%) 0
College
3 years 65 (59%) N/A
Bachelor‟s Degree 36 (33%)
Master‟s Degree 5 (4%)
Unspecified 5 (4%)
Method of Exit
Exit Counseling 49 (44%) 2 (15.4%)
Deprogramming 28 (25%) 2 (15.4%)
Walkaway 25 (23%) 9 (69.2%)
Unspecified 9 (8%) 0
Group Type
Fundtl.Aberrational 54 (49%) 4 (31%)
Charismatic 21 (19%) 4 (31%)
New Age/Eastern 8 (7%) 2 (15%)
Other Bible-based 10 (9%) 2 (15%)
Other 18 (16%) 1 (8%)
Pre-Cult Counseling
No 13 (10%) N/A
(22% of those who answered question)
Yes 47 (37%)