Cultic Studies Journal, Vol. 9, No. 2, 1992, Page 62
Pre-Post Changes
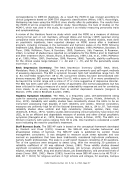
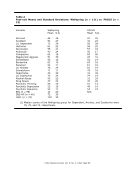
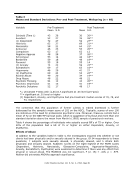
Table 3 reveals that there were statistically significant differences between Time I and Time
11 scores on 15 Millon scales. The MANOVA (effect-time) did reveal highly significant mean
differences between the MCMI-I pre- and post-treatment scores, Hotellings F (1, 20) =
4.11, p.001. The only scales that did not show a significant effect change, were Obsessive-
Compulsive, Paranoid, Hypomania, Drug Abuse, and Psychotic Delusions. All scales showing
significant change moved downward from Time I to Time 11, except for Histrionic,
Narcissistic, and Antisocial, which moved up. The elevation in these three scales in a
treatment study is not unusual in that successful treatment tends to increase self-esteem,
self-expressiveness, and to disinhibit inappropriate self-restraints (McMahon et al., 1986).
Among those scales that declined, the decline ranged from .4 to 1.0 standard deviations.
Psychotic Thinking declined from 54 to 42, a drop of one standard deviation. Dependent
declined from 72 to 52, or .74 SD. Somatoform and Negativistic-Aggressive declined about
.4 SD and Schizoid about .5 SD. The other scales all declined between .6 and .7 SD. The
effect size measures (partial eta squared) on scales with the highest BRs at Time I were as
follows: Dependent (.339), Somatoform (.100), Anxiety (.183), Histrionic (.138),
Narcissistic (.079), Compulsive/Conforming (.014), Passive Aggressive/Negativistic (.152),
Dysthyrnia (.172). All ANOVAs were significant, except for Compulsive/Conforming.
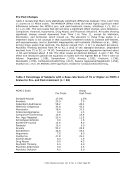
Table 4 Percentage of Subjects with a Base-rate Score of 75 or Higher on MCMI-I
Scales for Pre- and Post-treatment (n =66)
MCMI-I Scale Group
Pre-Treat. Post-Treat.
Schizoid-Asocial 17.9% 1.5%
Avoidant 23.9 7.5
Dependent-Submissive 58.2 28.4
Histrionic-Gregarious 32.8 43.3
Narcissistic 16.4 31.3
Antisocial-Aggressive 3.0 1.5
Compulsive-Conforming 10.4 14.9
Psv. Agg.-Negatvst. 25.4 11.9
Schizotypal-Schizoid 3.0 1.5
Borderline-Cycloid 13.4 9.0
Paranoid 13.4 3.0
Anxiety 52.2 26.9
Somatoform 35.8 19.4
Hypomanic 7.5 6.0
Dysthymia 47.8 25.4
Alcohol Abuse 6.0 1.5
Drug Abuse 9.0 4.5
Psychotic Thinking 4.5 0.0
Psychotic.Depression 0.0 4.5
Psychotic Delusion 4.5 0.0