Cultic Studies Journal, Vol. 15, No. 2, 1998, page 67
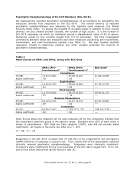
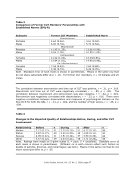
Table 3
Comparison of Former CUT Members’ Personalities with
Established Norms (EPQ-R)
Subscale Former CUT Members Established Norm
Psychoticism
Females 4.64 (0.46)a 4.61 (0.52)a
Males 6.00 (0.74)a 5.72 (0.64)a
Neuroticism
Females 11.45 (1.25)a 13.66 (0.96)a
Males 9.04 (1.38)a 10.55 (1.09)a
Extroversion
Females 11.52 (1.03)a 14.44(0.85)b
Males 12.84 (1.01)a 14.90 (0.95)b
Lie (dissimulation)
Females 7.54 (0.63)a 7.62 (0.68)a
Males 4.48 (0.74)a 6.22 (0.76)b
Note. Standard error of each mean is shown in parentheses. Means in the same row that
do not share subscripts differ at p .05. For former CUT members, n =33 females and 25
males.
The correlation between extroversion and time out of CUT was positive, r =.31, p =.019.
Neuroticism and time out of CUT were negatively correlated, r =-.55, p .001. The
correlation between neuroticism and extroversion was also negative, r =-.62, p .001.
Extroversion was negatively correlated with dissimulation, r =-.33, p .016. There were
negative correlations between dissimulation and measures of psychological distress on the
SCL-90-R for both the GSI, r =-.41, p =.002, and the number of high scores, r =-.35, p =
.009.
Table 4
Changes in the Reported Quality of Relationships Before, During, and After CUT
Involvement
Relationship Before n During n After n
Mother 2.71 (0.17)b 51 2.72 (0.19)a 51 4.17 (0.13)c 48
Father 3.57 (0.17)b 49 2.42 (0.20)a 45 4.05 (0.11)c 40
Spouse 4.05 (0.22)b 21 2.51 (0.24)a 37 3.50 (0.26)c 44
Other 4.47 (0.12)c 49 2.43 (0.21)a 48 3.71 (0.25)b 48
Note. Ratings were made on 5-point scales (1 =poor, 5 =excellent). Standard error of
each mean is shown in parentheses. (Different ns in each column reflect such factors as
deaths of parents, divorces, and remarriages see text.) Means in the same row that do not
share subscripts differ at p .05.