Cultic Studies Journal, Vol. 18, 2001, Page 70
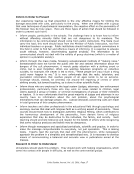
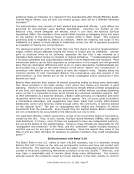
groups on campuses, student and staff involvement, and to ascertain if there were
specific counselors on staff prepared to assist students who may be involved in high
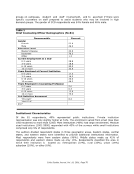
demand groups. The gender of CCO respondents was 54% female and 46% male.
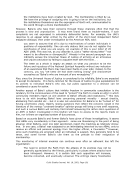
Table 1
Chief Counseling Officer Demographics (N=81)
Demographic Percent
Gender
Female 53.8
Male 46.3
Education Level
Master‘s Degree 22.5
Doctorate 76.3
Other 1.3
Current Employment as a CCO
0-2 years 28.8
3-5 years 18.8
6-10 years 20.0
10 or more 32.5
Years Employed at Current Institution
0-2 years 17.5
3-5 years 16.3
6-10 years 20.0
10 or more 46.3
Years Employed in Counseling Profession
0-2 years 5.0
3-5 years 6.3
6-10 years 13.8
10 or more 75.0
Cult Definition Agreement
―Pro-Cult‖ 6.3
―Anti-Cult‖
93.7
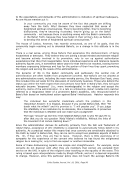
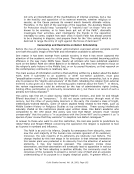
Institutional Characteristics
Of the 81 respondents, 49% represented public institutions. Private institution
representation was only slightly higher at 51%. The enrollment varied from small (less than
1000 students) to more than 5,000. Most institutions (48%) had large enrollments. Medium
sized institutions (1001-5000) responded with 43% of the surveys while small institutions
comprised only 9% of respondents.
The authors divided respondent states in three geographic areas. Eastern states, central
states, and western states were identified to provide additional institutional information.
Most respondents were from eastern states (46%). Middle states made up 41% of
respondents and western states made up only 13%. Respondents classified the area in
which their institution is located as: metropolitan (37%), rural (33%), urban (14%)
suburban (10%), or other (6%).
groups on campuses, student and staff involvement, and to ascertain if there were
specific counselors on staff prepared to assist students who may be involved in high
demand groups. The gender of CCO respondents was 54% female and 46% male.
Table 1
Chief Counseling Officer Demographics (N=81)
Demographic Percent
Gender
Female 53.8
Male 46.3
Education Level
Master‘s Degree 22.5
Doctorate 76.3
Other 1.3
Current Employment as a CCO
0-2 years 28.8
3-5 years 18.8
6-10 years 20.0
10 or more 32.5
Years Employed at Current Institution
0-2 years 17.5
3-5 years 16.3
6-10 years 20.0
10 or more 46.3
Years Employed in Counseling Profession
0-2 years 5.0
3-5 years 6.3
6-10 years 13.8
10 or more 75.0
Cult Definition Agreement
―Pro-Cult‖ 6.3
―Anti-Cult‖
93.7
Institutional Characteristics
Of the 81 respondents, 49% represented public institutions. Private institution
representation was only slightly higher at 51%. The enrollment varied from small (less than
1000 students) to more than 5,000. Most institutions (48%) had large enrollments. Medium
sized institutions (1001-5000) responded with 43% of the surveys while small institutions
comprised only 9% of respondents.
The authors divided respondent states in three geographic areas. Eastern states, central
states, and western states were identified to provide additional institutional information.
Most respondents were from eastern states (46%). Middle states made up 41% of
respondents and western states made up only 13%. Respondents classified the area in
which their institution is located as: metropolitan (37%), rural (33%), urban (14%)
suburban (10%), or other (6%).