Cultic Studies Journal, Vol. 14, No. 2, 1997, page 80
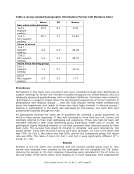
Table 2. Group-related Demographic Information (Former Cult Members Only)
Mean SD Range
Age when entered group
Cult 1
Support-
seeking
23.9 8.1 5-39
Cult 2
Non-support-
seeking
25.1 7.1 15-49
Years in group
Cult 1
Support-
seeking
6.6 6.3 .02-25
Cult 2
Non-support-
seeking
5.4 5.5 .08-22
Years since leaving group
Cult 1
Support-
seeking
7.5 5.7 .42-24
Cult 2
Non-support-
seeking
6.7 5.3 1-17
Procedures
Participants in this study were volunteers who were contacted through fliers distributed at
support meetings for former cult members (located throughout the United States), and at a
religiously sponsored psychotherapy clinic in Southern California. Volunteers were invited to
“participate in a research project about the psychological experiences of former members of
philosophical and religious groups ...that will help educate mental health professionals
about the experiences and needs of those who have been involved in abusive groups.”
Interest in participating in the study was expressed by 159 people, who were then sent
questionnaire packets through the mail.
All participants received the same set of guidelines for selecting a group experience on
which to base survey responses. If they had belonged to more than one cult, former cult
members referred to their most distressing cult experience. Those who had not been cult
members referred to their most distressing group experience, either past or current. All
participants clearly indicated whether or not they perceived their reference group to have
been cultic. The surveys took about 90 minutes to complete, and were returned by 104
people (65%). Those who returned a survey were paid 10 dollars. For Cult 1, the return rate
was 74% for Cult 2, the return rate was 50% and for the Comparison group, the return
rate was 59%. The rates of return for Cult 1 and Cult 2 were significantly different (X2 =
12.22 a =.01).
Results
Analysis of the ICE Index was conducted with the primary sample group (Cult 1). One
survey was excluded from analysis as the participant did not complete the ICE Index,
reducing the sample to 76. Item response frequencies were calculated for the 47 items on
the ICE Index. Three items, which were missing 14 or more responses, were subsequently