International Journal of Cultic Studies ■ Vol. 9, 2018 49
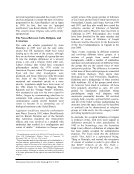
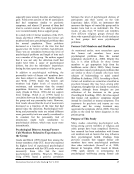
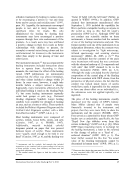
was not significant, it was of interest to analyze
the differences between the clinical group and
the former cult group on the subscales Risk to
Self and Risk to Others. On the Risk to Self-
scale, the mean score in the former cult group
was 0.57 (SD =0.93), in the clinical group the
mean score was 0.48 (SD =0.68). The
difference was not significant [t(1159) =.91,
ns]. On the Risk to Others scale, the mean score
in the former-cult group was 0.12 (SD =0.36),
and the mean score in the clinical group was
0.14 (SD =0.39). The difference was not
significant [t(1159) =.16, ns].
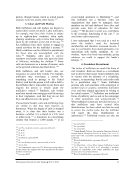
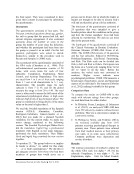
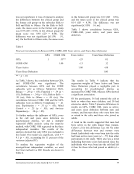
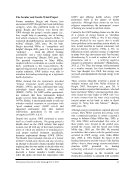
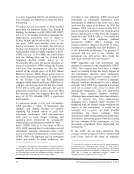
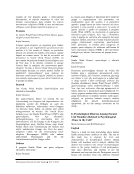
Table 3 shows correlations between GPA,
CORE–OM, years active, and years since
defection.
Table 3
Pearson Correlations (r) Between GPA, CORE–OM, Years Active, and Years Since Defection
GPA CORE–OM Years Active Years Since Defection
GPA 1 .33** -.23 .01
CORE–OM 1.00 -.13 .12
Years Active 1.00 -.08
Years Since Defection 1.00
**=p .01
As Table 3 shows, the correlation between GPA
and CORE–OM was significant. The
correlations between GPA and the CORE
subscales were as follows: Subjective Well-
Being r =.29 (p .05) Function r =.34 (p
.01) Problems r =.34 (p .01) Risk to Self r =
.20 (ns) Risk to Others r =.05 (ns) The
correlations between CORE–OM and the GPA
subscales were as follows: Compliance r =.21
(ns) Exploitation r =.31 (p .05) Mind
Control r =.25 (p .05) and Anxious
Dependency r =.30 (p .05).
To further analyze the influence of GPA, years
in the cult and years since defection on
psychological distress, we did a multiple
regression (MR) analysis using the stepwise
method, with CORE–OM regressed on the three
independent variables. The results of the
analysis showed that only GPA was included in
the model. The model was significant, with F =
9.1 (p .01), accounting for 11 percent of the
variance (adjusted R2).
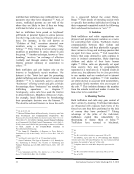
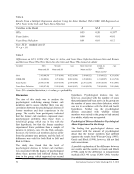
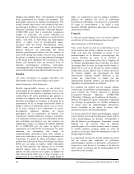
To analyze the regression weights of the
nonsignificant independent variables, we used
the Enter method in a MR. Results are shown in
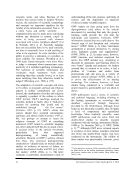
Table 4.
The results in Table 4 indicate that the
regression weights of Years Active and Years
Since Defection played a negligible part in
accounting for psychological distress as
measured by CORE–OM, whereas GPA showed
a significant association.
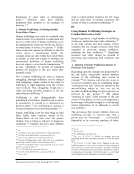
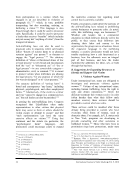
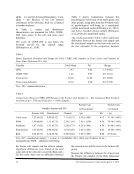
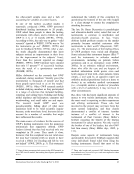
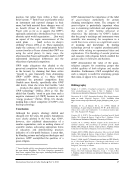
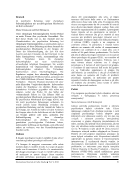
Of the participants, 36 had entered the cult at
birth or when they were children, and 30 had
entered as adults. Table 5 presents differences in
results on GPA, CORE–OM, years as active,
and years since defection between men and
women, and between those who were born into
or raised in the cults and those who joined as
adults.
A trend in the results suggested that men had
been active in the cults longer than women.
Cohen’s d for this difference was .44. No other
differences between men and women were
found. Individuals who were born into the cults
had been active more years (d =.77) than other
participants in the study. There also was a trend
indicating that more years had passed since the
individuals who were born into the cult had left
it than for those who had joined as adults (d =
.50).
was not significant, it was of interest to analyze
the differences between the clinical group and
the former cult group on the subscales Risk to
Self and Risk to Others. On the Risk to Self-
scale, the mean score in the former cult group
was 0.57 (SD =0.93), in the clinical group the
mean score was 0.48 (SD =0.68). The
difference was not significant [t(1159) =.91,
ns]. On the Risk to Others scale, the mean score
in the former-cult group was 0.12 (SD =0.36),
and the mean score in the clinical group was
0.14 (SD =0.39). The difference was not
significant [t(1159) =.16, ns].
Table 3 shows correlations between GPA,
CORE–OM, years active, and years since
defection.
Table 3
Pearson Correlations (r) Between GPA, CORE–OM, Years Active, and Years Since Defection
GPA CORE–OM Years Active Years Since Defection
GPA 1 .33** -.23 .01
CORE–OM 1.00 -.13 .12
Years Active 1.00 -.08
Years Since Defection 1.00
**=p .01
As Table 3 shows, the correlation between GPA
and CORE–OM was significant. The
correlations between GPA and the CORE
subscales were as follows: Subjective Well-
Being r =.29 (p .05) Function r =.34 (p
.01) Problems r =.34 (p .01) Risk to Self r =
.20 (ns) Risk to Others r =.05 (ns) The
correlations between CORE–OM and the GPA
subscales were as follows: Compliance r =.21
(ns) Exploitation r =.31 (p .05) Mind
Control r =.25 (p .05) and Anxious
Dependency r =.30 (p .05).
To further analyze the influence of GPA, years
in the cult and years since defection on
psychological distress, we did a multiple
regression (MR) analysis using the stepwise
method, with CORE–OM regressed on the three
independent variables. The results of the
analysis showed that only GPA was included in
the model. The model was significant, with F =
9.1 (p .01), accounting for 11 percent of the
variance (adjusted R2).
To analyze the regression weights of the
nonsignificant independent variables, we used
the Enter method in a MR. Results are shown in
Table 4.
The results in Table 4 indicate that the
regression weights of Years Active and Years
Since Defection played a negligible part in
accounting for psychological distress as
measured by CORE–OM, whereas GPA showed
a significant association.
Of the participants, 36 had entered the cult at
birth or when they were children, and 30 had
entered as adults. Table 5 presents differences in
results on GPA, CORE–OM, years as active,
and years since defection between men and
women, and between those who were born into
or raised in the cults and those who joined as
adults.
A trend in the results suggested that men had
been active in the cults longer than women.
Cohen’s d for this difference was .44. No other
differences between men and women were
found. Individuals who were born into the cults
had been active more years (d =.77) than other
participants in the study. There also was a trend
indicating that more years had passed since the
individuals who were born into the cult had left
it than for those who had joined as adults (d =
.50).