48 International Journal of Cultic Studies ■ Vol. 9, 2018
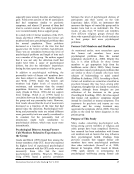
alpha =.61, and for Anxious Dependency, it was
alpha =.60. Because of the low internal
consistency in the subscales, their use is limited
in further analyses.
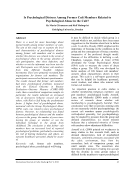
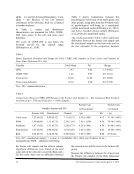
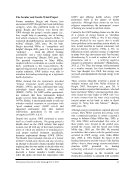
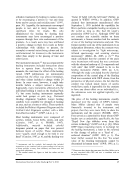
In Table 1, means and distribution
characteristics are presented for GPA, CORE–
OM, years active in the cult, and years since
defection.
The score on CORE–OM is just below the
Swedish cut-off for the clinical range
(Holmqvist et al., 2014).
Table 2 shows comparisons between the
psychological well-being of the participants and
other groups, using data from the Swedish study
of psychological well-being in a nonclinical
sample mentioned earlier (Elfström et al., 2012),
and from a Swedish clinical sample (Holmqvist
et al., 2014) also mentioned earlier.
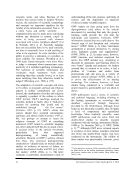
The results presented in Table 2 show significant
differences between the former cult sample and
the nonclinical sample on the total scale and on
the four subscales. In the comparison between
Table 1
Mean, Standard Deviation and Range for GPA, CORE–OM, Number of Years Active and Number of
Years Since Defection (N =66)
Variable Total Mean SD Range
GPA 3.47 0.52 1.7–04.52
CORE–OM 1.25 0.83 0.0–03.32
Years active 18.30 11.80 2.0–60.00
Years since defection 10.10 8.00 0.0–27.00
Note. SD =standard deviation
Table 2
Comparisons Between CORE–OM Ratings in the Former Cult Sample (n =66) Compared With Swedish
Nonclinical (n =229) and Clinical (n =1095) Samples
Samples (means and SD)
Former Cult
vs Nonclinical
Former Cult
vs Clinical
Former Cult Nonclinical Clinical t (p) ES t (p)
Total score 1.25 (0.83) 0.90 (0.52) 1.71 (0.57) 4.16 (.001) 0.52 37.10 (.001)
SWB 1.40 (0.66) 1.15 (0.75) 2.30 (1.10) 2.45 (.020) 0.36 76.10 (.001)
Problems 1.67 (1.02) 1.15 (0.73) 2.28 (0.73) 4.26 (.001) 0.59 41.40 (.001)
Functioning 1.26 (0.85) 0.94 (0.60) 1.61 (0.60) 3.45 (.001) 0.42 19.20 (.001)
Risk 0.34 (0.51) 0.14 (0.32) 0.30 (0.42) 3.86 (.001) 0.48 0.63 (ns)
Note. SD =standard deviation t =t-value p =probability ES =effect size (Cohen’s d) ns =
nonsignificant SWB =subjective well-being
the former cult sample and the clinical sample,
significant differences were found on the total
scale and on the subscales except the Risk scale.
On this scale, there was no difference between
the clinical score and the score in the former cult
group.
Because the difference between the clinical and
the former cult samples on the Risk dimension
alpha =.61, and for Anxious Dependency, it was
alpha =.60. Because of the low internal
consistency in the subscales, their use is limited
in further analyses.
In Table 1, means and distribution
characteristics are presented for GPA, CORE–
OM, years active in the cult, and years since
defection.
The score on CORE–OM is just below the
Swedish cut-off for the clinical range
(Holmqvist et al., 2014).
Table 2 shows comparisons between the
psychological well-being of the participants and
other groups, using data from the Swedish study
of psychological well-being in a nonclinical
sample mentioned earlier (Elfström et al., 2012),
and from a Swedish clinical sample (Holmqvist
et al., 2014) also mentioned earlier.
The results presented in Table 2 show significant
differences between the former cult sample and
the nonclinical sample on the total scale and on
the four subscales. In the comparison between
Table 1
Mean, Standard Deviation and Range for GPA, CORE–OM, Number of Years Active and Number of
Years Since Defection (N =66)
Variable Total Mean SD Range
GPA 3.47 0.52 1.7–04.52
CORE–OM 1.25 0.83 0.0–03.32
Years active 18.30 11.80 2.0–60.00
Years since defection 10.10 8.00 0.0–27.00
Note. SD =standard deviation
Table 2
Comparisons Between CORE–OM Ratings in the Former Cult Sample (n =66) Compared With Swedish
Nonclinical (n =229) and Clinical (n =1095) Samples
Samples (means and SD)
Former Cult
vs Nonclinical
Former Cult
vs Clinical
Former Cult Nonclinical Clinical t (p) ES t (p)
Total score 1.25 (0.83) 0.90 (0.52) 1.71 (0.57) 4.16 (.001) 0.52 37.10 (.001)
SWB 1.40 (0.66) 1.15 (0.75) 2.30 (1.10) 2.45 (.020) 0.36 76.10 (.001)
Problems 1.67 (1.02) 1.15 (0.73) 2.28 (0.73) 4.26 (.001) 0.59 41.40 (.001)
Functioning 1.26 (0.85) 0.94 (0.60) 1.61 (0.60) 3.45 (.001) 0.42 19.20 (.001)
Risk 0.34 (0.51) 0.14 (0.32) 0.30 (0.42) 3.86 (.001) 0.48 0.63 (ns)
Note. SD =standard deviation t =t-value p =probability ES =effect size (Cohen’s d) ns =
nonsignificant SWB =subjective well-being
the former cult sample and the clinical sample,
significant differences were found on the total
scale and on the subscales except the Risk scale.
On this scale, there was no difference between
the clinical score and the score in the former cult
group.
Because the difference between the clinical and
the former cult samples on the Risk dimension