Cultic Studies Review, Vol. 2, No. 3, 2003, Page 11
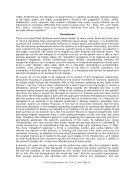
Pearson correlation coefficients were also calculated between the subscales and between
subscales and the global scale. In both cases, the correlations reached the significance level
of 0.01.
Validity Analysis
The construct validity, or the organization and precision of the constructs analyzed within a
coherent theoretical framework (Muñiz, 1998), was examined through an exploratory factor
analysis. This analysis helped elicit latent variables, which were lying under the group of
observed variables (García, Gil &Rodríguez, 2000). This method has become one of the
most frequently used alternatives when there is an absence of a pattern or criterion, as in
our case. The extraction method used was Principal Components and Oblimin rotation.
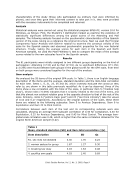
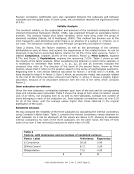
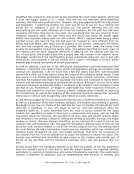
Table 2 shows, first, the factors obtained, as well as the percentage of the variance
attributable to each of them, and second, the eigenvalues of the rotated factors. As can be
observed, three factors accounted before rotation for 42.3% of the total variance. Factor 1,
labeled Compliance, explains 26.6% of the variance Factor 2, Mind Control, explains
8.7% and Factor 3, Exploitation, explains the remaining 7.01%. Table 2 shows as well
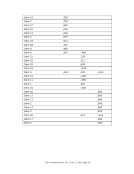
the results of the factor analysis. When considering the direction in which items saturate, it
is necessary to remember that items 1, 5, 21, 22, 25 and 26 inversely evaluate the
construct they refer to. The direction of the items of the second factor, known as Mind
Control, shows that it refers to the positive aspect in the sense of psychological autonomy.
Regarding item 9, with almost identical saturation for factors 1 (0.410) and 2 (-0.408), we
have decided to keep it in Factor 2. Item 5 which, as previously noted, was scarcely related
to the rest of the items has been removed from Factor 2, where it shows a slightly higher
saturation, because of its discordant behavior with the rest of the items which compose
Factor 2.
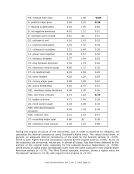
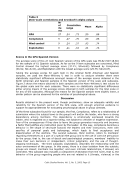
Item-subscales correlations
Given the new subscales, correlations between each item of the test and its corresponding
scale and subscale were calculated. Table 3 shows the range of item-scale correlation values
(out of 27 items, not including item 5) as well as item-subscales, average and number of
items belonging to each of the subscales (n). Item-subscale correlations were all over 0.20
for all of the items, with the average values higher than those obtained in the original
distribution of the scale.
Reliability Analysis
We also analyzed the reliability of the three subscales by calculating the internal consistency
using Cronbach‘s Alpha Index. Table 3, contains the internal consistency values obtained for
each subscale. As it can be observed, all the values are above 0.70, showing an adequate
internal consistency for each of the three subscales. On the other hand, the final 27-item
scale (once item 5 was removed) produced an alpha index of 0.88.
Table 2
Factors, with eigenvalue and percentage of explained variance.
Factor Label %Variance Eigenvalue
1 Compliance 26.56 5.99
2 Mind Control 8.71 3.58
3 Exploitation 7.01 4.55
1 2 3
Pearson correlation coefficients were also calculated between the subscales and between
subscales and the global scale. In both cases, the correlations reached the significance level
of 0.01.
Validity Analysis
The construct validity, or the organization and precision of the constructs analyzed within a
coherent theoretical framework (Muñiz, 1998), was examined through an exploratory factor
analysis. This analysis helped elicit latent variables, which were lying under the group of
observed variables (García, Gil &Rodríguez, 2000). This method has become one of the
most frequently used alternatives when there is an absence of a pattern or criterion, as in
our case. The extraction method used was Principal Components and Oblimin rotation.
Table 2 shows, first, the factors obtained, as well as the percentage of the variance
attributable to each of them, and second, the eigenvalues of the rotated factors. As can be
observed, three factors accounted before rotation for 42.3% of the total variance. Factor 1,
labeled Compliance, explains 26.6% of the variance Factor 2, Mind Control, explains
8.7% and Factor 3, Exploitation, explains the remaining 7.01%. Table 2 shows as well
the results of the factor analysis. When considering the direction in which items saturate, it
is necessary to remember that items 1, 5, 21, 22, 25 and 26 inversely evaluate the
construct they refer to. The direction of the items of the second factor, known as Mind
Control, shows that it refers to the positive aspect in the sense of psychological autonomy.
Regarding item 9, with almost identical saturation for factors 1 (0.410) and 2 (-0.408), we
have decided to keep it in Factor 2. Item 5 which, as previously noted, was scarcely related
to the rest of the items has been removed from Factor 2, where it shows a slightly higher
saturation, because of its discordant behavior with the rest of the items which compose
Factor 2.
Item-subscales correlations
Given the new subscales, correlations between each item of the test and its corresponding
scale and subscale were calculated. Table 3 shows the range of item-scale correlation values
(out of 27 items, not including item 5) as well as item-subscales, average and number of
items belonging to each of the subscales (n). Item-subscale correlations were all over 0.20
for all of the items, with the average values higher than those obtained in the original
distribution of the scale.
Reliability Analysis
We also analyzed the reliability of the three subscales by calculating the internal consistency
using Cronbach‘s Alpha Index. Table 3, contains the internal consistency values obtained for
each subscale. As it can be observed, all the values are above 0.70, showing an adequate
internal consistency for each of the three subscales. On the other hand, the final 27-item
scale (once item 5 was removed) produced an alpha index of 0.88.
Table 2
Factors, with eigenvalue and percentage of explained variance.
Factor Label %Variance Eigenvalue
1 Compliance 26.56 5.99
2 Mind Control 8.71 3.58
3 Exploitation 7.01 4.55
1 2 3