Cultic Studies Journal, Vol. 5, No. 1 1988 Page 28
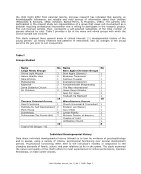
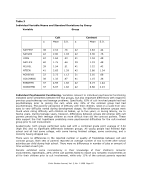
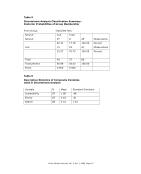
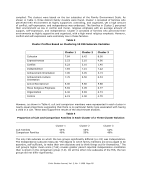
compiled. The clusters were based on the ten subscales of the Family Environment Scale. As
shown in Table 3, three distinct family clusters were found. Cluster I consisted of families who
perceived their environment as highly supportive, controlling, and organized, yet a high amount
of conflict, self-expression, and independence was evidenced. The families in Cluster 2 perceived
their environment as low in control and moral- religious emphasis with an average amount of
support, self-expression, and independence. Cluster 3 consisted of families who perceived their
environments as highly supportive and organized, with a high moral religious emphasis. However,
conflict and self-expression were extremely low in these families.
Table 3
Cluster Profiles Based on Clustering 10 FES Subscale Variables
Cluster 1 Cluster 2 Cluster 3
Cohesion 7.84 6.45 8.00
Expressiveness 5.53 5.10 4.96
Conflict 5.23 3.10 1.40
Independence 7.84 7.15 7.22
Achievement-Orientation 7.00 5.05 5.74
Achievement-Culture
Orientation
7.76 6.50 6.53
Active Recreational 6.00 5.80 5.88
Moral Religious Emphasis 5.69 3.05 6.77
Organization 6.46 5.65 6.74
Control 6.15 4.00 4.70
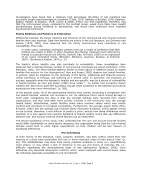
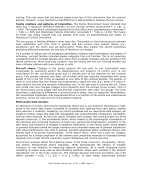
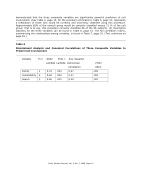
However, as shown in Table 4, cult and comparison members were represented in each cluster in
nearly equal proportions suggesting that there is no particular family type associated with having
a child in a cult. These data support the results of the discriminant analysis.
Table 4
Proportion of Cult and Comparison Families in Each Cluster of a Three Cluster Solution
Cluster 1 Cluster 2 Cluster 3
Cult Families 54% 50% 52%
Comparison Families 46% 50% 48%
The only FES subscale on which the two groups significantly differed (p.03) was Independence.
The Independence subscale measures ―the degree to which family members are encouraged to be
assertive, self-sufficient, to make their own decisions and to think things out for themselves.‖ The
cult group's higher mean score (7.64) reveals greater parent-reported independence orientation
than is shown in the comparison group (7.0). On all the other nine subscales of the FES, the two
groups did not differ significantly,
compiled. The clusters were based on the ten subscales of the Family Environment Scale. As
shown in Table 3, three distinct family clusters were found. Cluster I consisted of families who
perceived their environment as highly supportive, controlling, and organized, yet a high amount
of conflict, self-expression, and independence was evidenced. The families in Cluster 2 perceived
their environment as low in control and moral- religious emphasis with an average amount of
support, self-expression, and independence. Cluster 3 consisted of families who perceived their
environments as highly supportive and organized, with a high moral religious emphasis. However,
conflict and self-expression were extremely low in these families.
Table 3
Cluster Profiles Based on Clustering 10 FES Subscale Variables
Cluster 1 Cluster 2 Cluster 3
Cohesion 7.84 6.45 8.00
Expressiveness 5.53 5.10 4.96
Conflict 5.23 3.10 1.40
Independence 7.84 7.15 7.22
Achievement-Orientation 7.00 5.05 5.74
Achievement-Culture
Orientation
7.76 6.50 6.53
Active Recreational 6.00 5.80 5.88
Moral Religious Emphasis 5.69 3.05 6.77
Organization 6.46 5.65 6.74
Control 6.15 4.00 4.70
However, as shown in Table 4, cult and comparison members were represented in each cluster in
nearly equal proportions suggesting that there is no particular family type associated with having
a child in a cult. These data support the results of the discriminant analysis.
Table 4
Proportion of Cult and Comparison Families in Each Cluster of a Three Cluster Solution
Cluster 1 Cluster 2 Cluster 3
Cult Families 54% 50% 52%
Comparison Families 46% 50% 48%
The only FES subscale on which the two groups significantly differed (p.03) was Independence.
The Independence subscale measures ―the degree to which family members are encouraged to be
assertive, self-sufficient, to make their own decisions and to think things out for themselves.‖ The
cult group's higher mean score (7.64) reveals greater parent-reported independence orientation
than is shown in the comparison group (7.0). On all the other nine subscales of the FES, the two
groups did not differ significantly,