Cultic Studies Journal, Vol. 5, No. 1 1988 Page 16
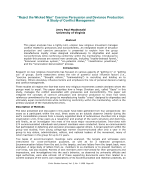
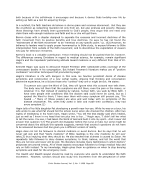
Table 7
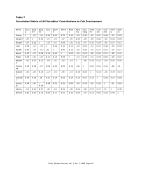
Correlation Matrix of All Variables' Contributions to Cult Involvement
Name Grou
p
Satp
erf
Satg
en
Loss Satlif
e
Relrel Ntee
n
Agre
evo
Colc
hang
Enbo
thr
Lcob
oth
Vuln
erbl
Fami
ly
Sear
ch
Group 1 -.25 -.24 0.29 0.42 0.33 0.10 -.42 0.20 -.45 0.07 0.46 -.53 0.02
Satperf -.25 1 0.22 -.15 -.19 -.07 -.35 0.23 -.28 -.05 0.20 -.39 0.34 0.03
Satgen -.24 0.22 1 -.33 -.01 0.08 -.32 0.12 -.07 0.10 0.18 -.36 0.57 0.15
Loss 0.29 -.15 -.33 1 0.26 0.10 0.12 -.04 0.04 -.12 0.21 0.48 -.30 0.04
Satlife 0.42 -.19 -.01 .26 1 0.40 0.15 -.25 0.20 -.19 0.17 0.51 -.19 0.17
Relrel 0.33 -.07 0.08 0.10 0.40 1 0.09 -.20 0.03 -.05 0.03 0.21 -.05 0.31
Nteen 0.30 -.35 -.32 0.12 0.15 0.09 1 -.14 0.19 -.13 0.19 0.84 -.30 0.10
Agreev
o
-.42 0.23 0.12 -.04 -.25 -.20 -.14 1 -.06 0.19 0.12 -/24 0.55 0.05
Colcha
ng
0.20 0.28 -.07 0.08 0.20 0.03 0.19 -.06 1 0.02 0.01 0.44 -.09 .01
Exboth
r
-.45 -.05 0.10 -.12 -.19 -.05 -.13 0.19 0.02 1 0.12 -.16 0.72 0.13
Icoboth
r
0.07 0.20 .18 0.21 0.17 0.03 0.19 0.12 0.01 0.12 1 0.25 0.17 0.83
Vulner
bl
0.46 -.39 -
0.36
0.48 0.51 0.21 0.84 -.24 0.44 -.16 0.25 1 -.31 0.18
Family -.53 0.34 0.57 -.30 -.19 0.05 -.30 0.55 -.09 0.72 0.17 .31 1 0.40
Search 0.02 0.03 0.15 0.04 0.17 0.31 0.10 0.05 -.03 0.13 0.83 0.18 0.40 1
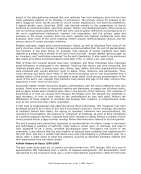
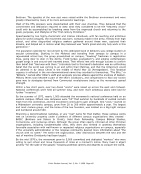
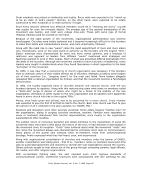
Table 7
Correlation Matrix of All Variables' Contributions to Cult Involvement
Name Grou
p
Satp
erf
Satg
en
Loss Satlif
e
Relrel Ntee
n
Agre
evo
Colc
hang
Enbo
thr
Lcob
oth
Vuln
erbl
Fami
ly
Sear
ch
Group 1 -.25 -.24 0.29 0.42 0.33 0.10 -.42 0.20 -.45 0.07 0.46 -.53 0.02
Satperf -.25 1 0.22 -.15 -.19 -.07 -.35 0.23 -.28 -.05 0.20 -.39 0.34 0.03
Satgen -.24 0.22 1 -.33 -.01 0.08 -.32 0.12 -.07 0.10 0.18 -.36 0.57 0.15
Loss 0.29 -.15 -.33 1 0.26 0.10 0.12 -.04 0.04 -.12 0.21 0.48 -.30 0.04
Satlife 0.42 -.19 -.01 .26 1 0.40 0.15 -.25 0.20 -.19 0.17 0.51 -.19 0.17
Relrel 0.33 -.07 0.08 0.10 0.40 1 0.09 -.20 0.03 -.05 0.03 0.21 -.05 0.31
Nteen 0.30 -.35 -.32 0.12 0.15 0.09 1 -.14 0.19 -.13 0.19 0.84 -.30 0.10
Agreev
o
-.42 0.23 0.12 -.04 -.25 -.20 -.14 1 -.06 0.19 0.12 -/24 0.55 0.05
Colcha
ng
0.20 0.28 -.07 0.08 0.20 0.03 0.19 -.06 1 0.02 0.01 0.44 -.09 .01
Exboth
r
-.45 -.05 0.10 -.12 -.19 -.05 -.13 0.19 0.02 1 0.12 -.16 0.72 0.13
Icoboth
r
0.07 0.20 .18 0.21 0.17 0.03 0.19 0.12 0.01 0.12 1 0.25 0.17 0.83
Vulner
bl
0.46 -.39 -
0.36
0.48 0.51 0.21 0.84 -.24 0.44 -.16 0.25 1 -.31 0.18
Family -.53 0.34 0.57 -.30 -.19 0.05 -.30 0.55 -.09 0.72 0.17 .31 1 0.40
Search 0.02 0.03 0.15 0.04 0.17 0.31 0.10 0.05 -.03 0.13 0.83 0.18 0.40 1