Cultic Studies Journal, Vol. 5, No. 1 1988 Page 14
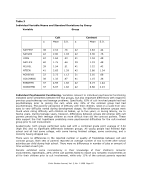
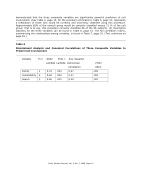
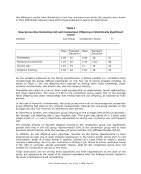
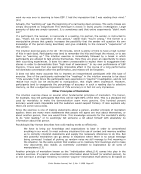
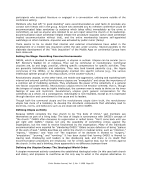
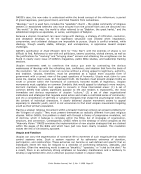
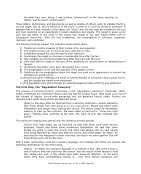
demonstrated that the three composite variables are significantly powerful predictors of cult
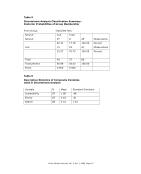
involvement. (See Table 4, page 13, for the summary information.) Table 5, page 14, represents
a breakdown of those who would be correctly and incorrectly classified using this procedure.
Approximately 82% of the noncult group would be correctly classified versus 71 %of the cult
group that is to say, this procedure correctly classified 66 of the 86 subjects. (2) Descriptive
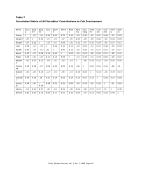
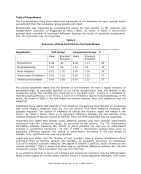
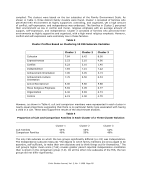
statistics for the three variables can be found in Table 6, page 15. The full correlation matrix,
summarizing the relationships among variables, is found in Table 7, page 16. (Text continues on
page 16.)
Table 4
Discriminant Analysis and Canonical Correlations of Three Composite Variables to
Predict Cult Involvement
Variable #in Wilks‘ Prob Avg. Squared
Lambda Lambda Cannonican Prob
Correlation ASCC
Family 1 0.72 .001 0.27 .001
Vulnerability 2 0.62 .001 0.37 .001
Search 3 0.60 .001 0.40 .001
demonstrated that the three composite variables are significantly powerful predictors of cult
involvement. (See Table 4, page 13, for the summary information.) Table 5, page 14, represents
a breakdown of those who would be correctly and incorrectly classified using this procedure.
Approximately 82% of the noncult group would be correctly classified versus 71 %of the cult
group that is to say, this procedure correctly classified 66 of the 86 subjects. (2) Descriptive
statistics for the three variables can be found in Table 6, page 15. The full correlation matrix,
summarizing the relationships among variables, is found in Table 7, page 16. (Text continues on
page 16.)
Table 4
Discriminant Analysis and Canonical Correlations of Three Composite Variables to
Predict Cult Involvement
Variable #in Wilks‘ Prob Avg. Squared
Lambda Lambda Cannonican Prob
Correlation ASCC
Family 1 0.72 .001 0.27 .001
Vulnerability 2 0.62 .001 0.37 .001
Search 3 0.60 .001 0.40 .001